Navigation timing API has been around in browsers for several years now, but I’m still often surprised how many people I meet that have never heard of it or don’t actually understand it. If you fall into this category consider this a quick primer.
Frontend web performance matters. This is the time it takes from the moment my browser starts a request for a URI to the moment the page is fully loaded (or functional and visible – different people want to measure different things). If you’re not convinced it’s important consider the fact that Google includes page speed in it’s prioritization algorithm and many different studies (including our data from Torbit) show a correlation between site performance and conversions.
Ok great, so performance matters – now what? Well in the past it turns out it was actually pretty hard to reliably measure frontend performance on your site. There was synthetic testing (basically a fixed browser in the cloud that would hit a site and record timing data), but this was not usually representative of actual end users because the testing took place on big internet backbones with relatively fast computers.
So some sites starting doing various hacks to calculate the load time in the browser when visitors would come to their site. The initial implementations of this were basically just hooking into the browser onload event and subtracting the start time from a script inserted into the head of the document. Over time these hacks got a little more sophisticated (using cookies to track time since you started to unload the previous page, for example), but they were definitely hacks.
Then came the magic of the navigation timing API. Essentially this is a Javascript API available in most modern browsers that gives you direct access to a bunch of timing information about the page load on the current page.
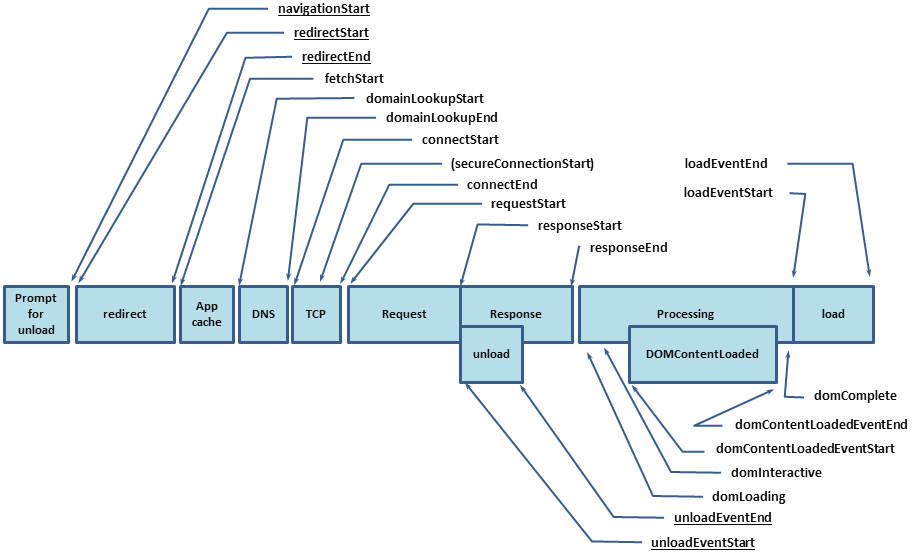
With navigation timing you could now access a new property window.performance.timing that had entries for all the major timing events shown in the graphic above in milliseconds. For example:
window.performance.timing.loadEventEnd
Finally you can get access to the actual load time the current visitor experienced for the DNS lookup, the TCP connection, the transfer time, and fully loaded time (among others). Then you can use that data to either take an action for the current user or beacon it back to a central server for aggregation and reporting. This is fundamentally what all RUM tools do (including Torbit’s Insight product).
So if you’re not already using navigation timing give it a spin. You might be surprised to see how slow your site can be for some users.
